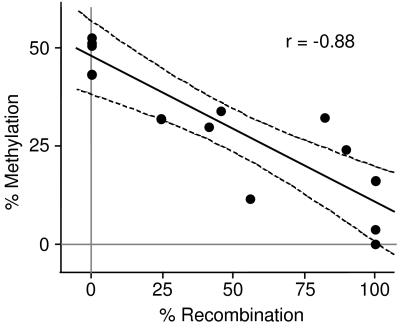
Figure 5.
Negative correlation of the level of DNA methylation and the extent of lox-Piga-lacZ recombination. The plot displays the percentage of methylation at the 5′ SacII site of the wt gene (y axis) as a function of the amount of recombination of the lox-Piga-lacZ gene (x axis). Shown are the regression line and the 95% confidence interval. r, correlation coefficient.

