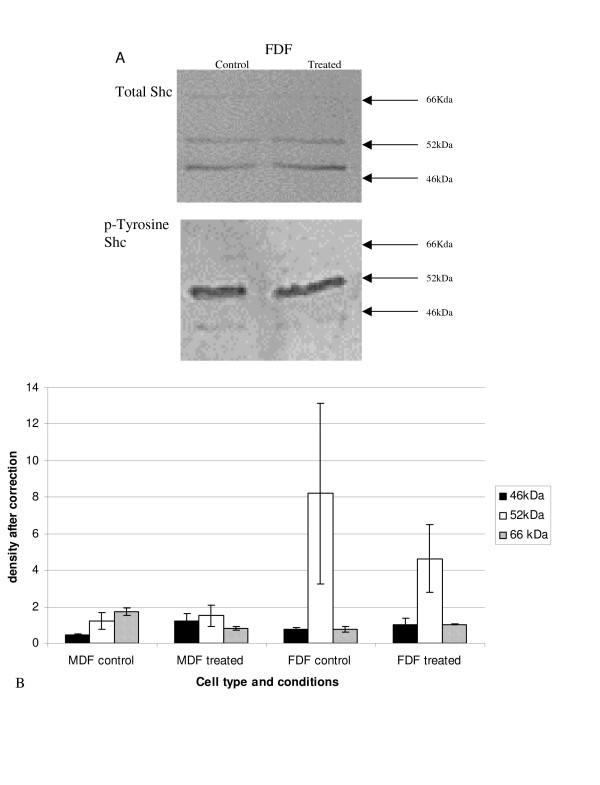
Figure 7.
Tyrosine phosphorylated Shc after stimulation with IGF-I. A: Protein lysates from cells treated with IGF-I for 20 mins were analysed by Western blot. A: Shows a representative western blot analysis for total Shc. Protein lysates were immunoprecipiated with an anti-Shc antibody as described in the materials and methods and the precipitate was run on a western blot and stained with the antibody p-Tyr and a representative western is shown in B. B: A graph representing the densitometry, after correcting for total-Shc. Bars show average for n = 5 FDF and n = 5 MDF and SEM (closed bar 46 kDa, open bar 52 kDa, and hashed bar 66 kDa). No statistical difference was demonstrated for any group.

