
Figure 1.
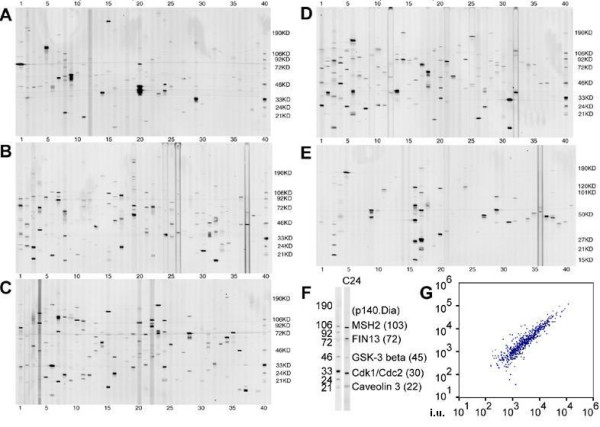
PowerBlot analysis of undifferentiated BG01 hESCs. This large-scale western blot consisted of five gels run in duplicate and probed with 934 antibodies. (A-E) One set of blots is shown at a contrast that highlights most bands. (F) A representative lane (gel C, lane 24) aligned with protein markers used for band identification. (G) Scatter-plot of the normalized average intensity (i.u.) values for each protein indicating a linear relationship between duplicate blots. Datasets for this analysis are in Additional Tables 1 and 2.