
Figure 2. (A) In ROZA-expressing Jurkat T-cells, PV induces changes in the 436→535 and in the 436→470 signals (top) and in their ratio (bottom).
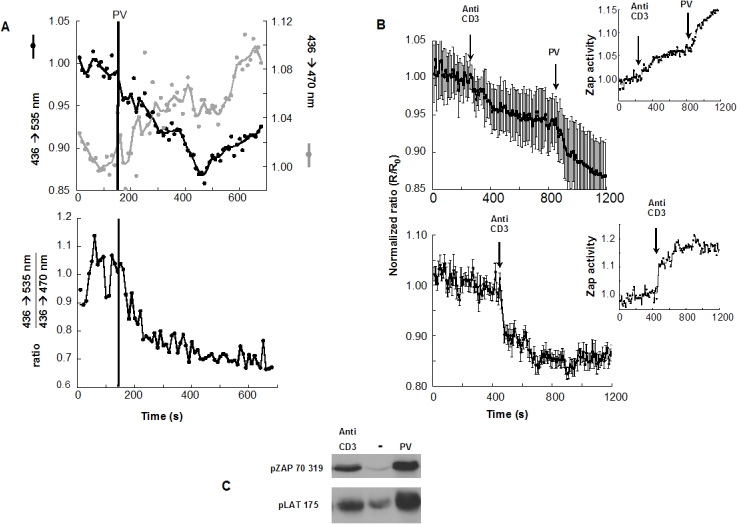
Traces correspond to the mean of 3 different T-cells. (B) In Jurkat T-cells (top), anti-CD3 induces a partial activation of ZAP-70 that can be completed by PV. In peripheral blood T-cells (bottom), anti-CD3 triggers a large and rapid FRET decrease. Inset: ZAP-70 activity is shown as the inverse of the FRET signals. Traces correspond to the average of 8–17 individual cells. (C) In Jurkat T-cells stably expressing ROZA and stimulated with PV or anti-CD3, ZAP-70 (site 319) as well as endogenous LAT (site 175) are phosphorylated after a 2 minute stimulation.