
Figure 4. Synaptic and antisynaptic activation of ROZA.
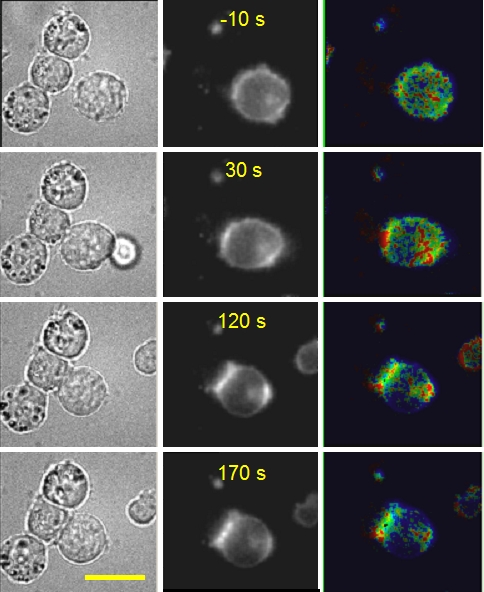
Sequence of events observed upon interaction of a ROZA-expressing Jurkat T-cell with superantigen-loaded Raji B cells. Left: transmitted light images; center: subcellular ROZA localization; right: ZAP-70-dependent activity in false colours, 1/R ranging from 1.25 (blue) to 1.7 (red). Time zero corresponds to the initial contact, as detected in transmitted light images. The bar corresponds to 10 microns.