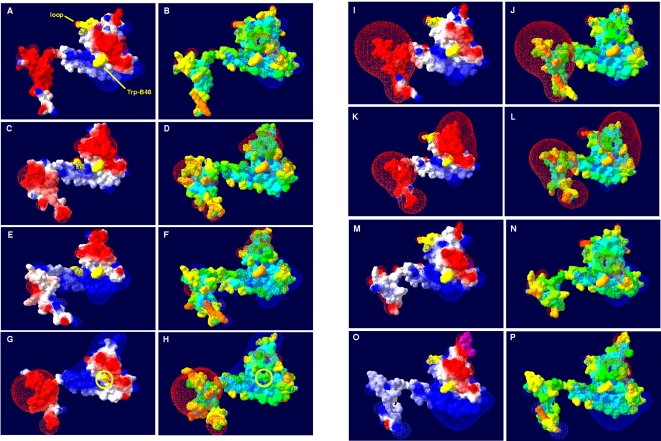
Figure 4. Three-dimensional structure of AprB from A. fulgidus (A, B) and selected, homology modeling-based AprB models from Allochromatium vinosum (C, D), Pelagibacter ubique (E, F), Pyrobaculum calidifontis (G, H), Desulfotomaculum reducens (I, J), Desulfovibrio vulgaris (K, L), Chlorobaculum tepidum (M, N) and Thiobacillus denitrificans (O, P).
Protein molecular surface colored by calculated electrostatic potential are shown in panels A, C, E, G, I, K, M, O (electric charge at the molecular surface is colored with a red (negative), white (neutral), and blue (positive) color gradient; electric field extending into the solvent is shown); the differently present, negatively charged loops in the models of SRP and SOB are marked by yellow color (the additional loop of Thiobacillus denitrificans is shown in violet); the electron-transferring Trp-B43/-B48 is marked by yellow color (Pyrobaculum calidifontis: Trp-substituting Ala-B43 is highlighted in G and H). Protein molecular surface colored by calculated solvent accessibility are shown in panels B, D, F, H, J, L, N, P.

