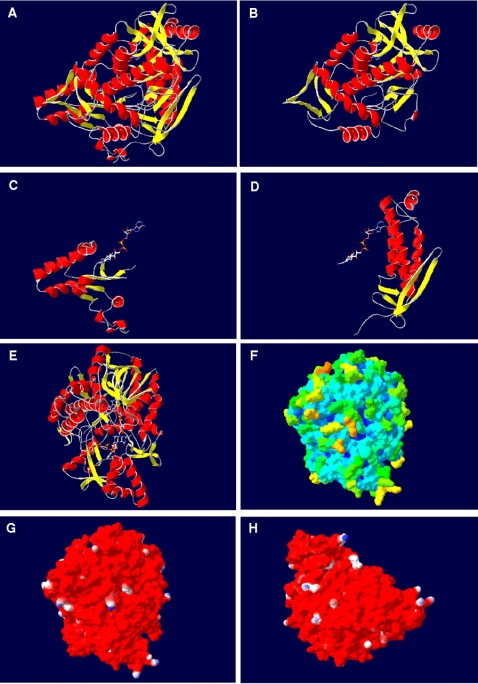
Figure 6. Structure of AprA from A. fulgidus.
(A–E) Ribbon structure colored by secondary structure elements (position of FAD cofactor indicated), (A) entire model from front view, (B) only FAD-binding domain, (C) only capping domain, (D) only helical domain, and (E) entire protein from top view (position of APS molecule indicated additionally); (F) protein molecular surface colored by calculated solvent accessibility shown from top view; (G, H) protein molecular surface colored by calculated electrostatic potential shown from top and back view (electric charge at the molecular surface is colored with a red (negative), white (neutral, and blue (positive) color gradient).

