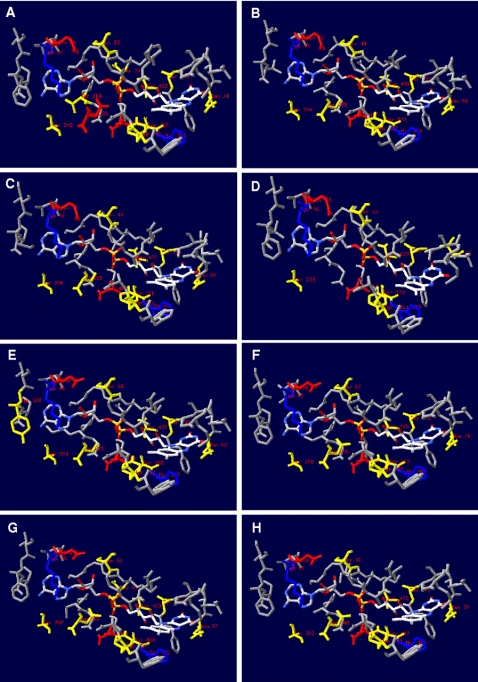
Figure 8. AprA protein matrix surrounding the FAD cofactor (residues in a distance of less than 4.1 Å are shown) in the three-dimensional structure from A. fulgidus (A) and selected, homology modeling-based models from Allochromatium vinosum (B), Pelagibacter ubique (C), Pyrobaculum calidifontis (D), Desulfotomaculum reducens (E), Desulfovibrio vulgaris (F), Chlorobaculum tepidum (G), and Thiobacillus denitrificans (H).
Charged and polar residues are marked (positively charged AA, blue; negatively charged AA, red; polar AA, yellow; uncharged/-polar AA, grey).

