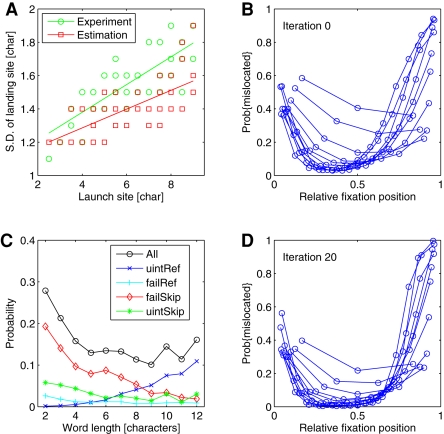
Figure 4. Random component of saccade errors and probabilities of mislocated fixations.
(A) The random component of saccade errors is characterized by the standard deviation of the landing site distribution as a function of launch site distance. Distances are given as values from the center of the word. Best linear fits are also presented for experimental (green) vs. simulated (red) data. The reduced slope for the simulated data indicates the variance reduction achieved by our iterative estimation procedure. (B) Proportion of mislocated fixation as a function of relative fixation position for different word lengths (each curve represents a word length). For iteration 0, within-word distributions of mislocated fixations for word lengths 2 to 12 peak near word edges. (C) The overall probability of mislocated fixations (black) varies between about 10% and 30% for word lengths 2 to 12. For short to medium-sized words (<8 characters), failed skippings represent the most frequently occurring case of mislocated fixations, while for long words (>8 characters) unintended refixations are most important. (D) After 20 iterations, the proportion of mislocated fixations can be approximated by a single U-shaped curved for all words with lengths greater than 5 characters.

