
Figure 2.
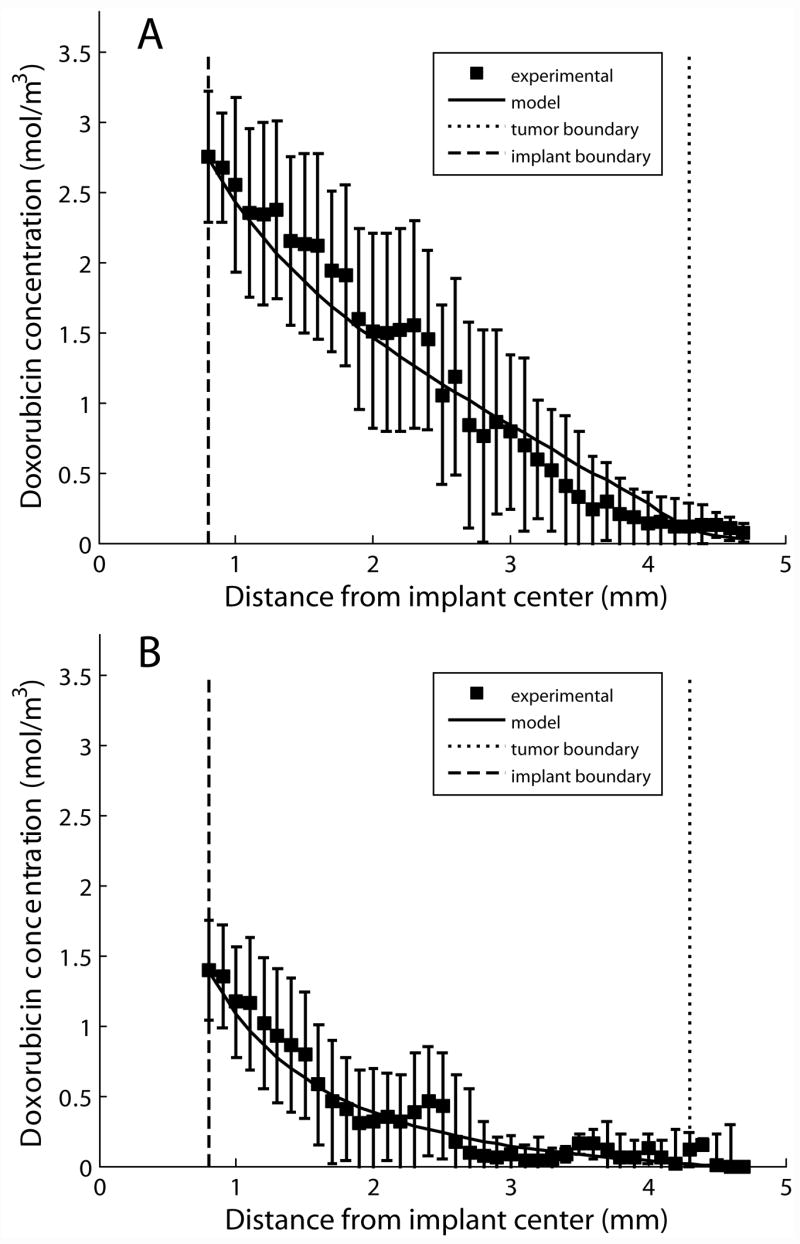
Modeling results from parameter estimation in ablated tumor. Experimental radial drug distributions are shown compared to model output on day 4 (A, n = 4) and day 8 (B, n = 3). The error bars show the standard error of the mean.
Official websites use .gov
A
.gov website belongs to an official
government organization in the United States.
Secure .gov websites use HTTPS
A lock (
) or https:// means you've safely
connected to the .gov website. Share sensitive
information only on official, secure websites.
Modeling results from parameter estimation in ablated tumor. Experimental radial drug distributions are shown compared to model output on day 4 (A, n = 4) and day 8 (B, n = 3). The error bars show the standard error of the mean.