
Figure 5.
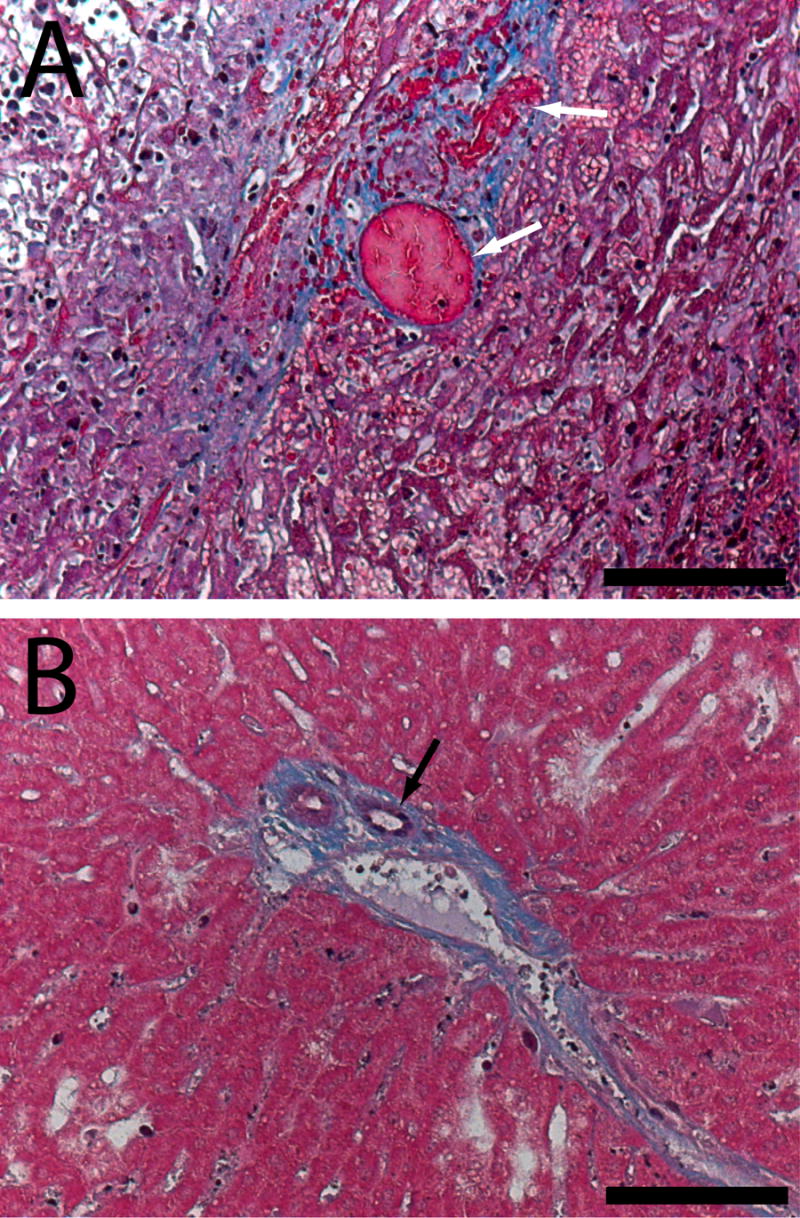
Masson’s trichrome histology showing coagulated blood vessels (white arrows) in the ablated tumor region 4 days after ablation (A). By day 8 (B), new blood vessels (black arrow) are forming in the ablated region. Scale bars are 100 μm.
Official websites use .gov
A
.gov website belongs to an official
government organization in the United States.
Secure .gov websites use HTTPS
A lock (
) or https:// means you've safely
connected to the .gov website. Share sensitive
information only on official, secure websites.
Masson’s trichrome histology showing coagulated blood vessels (white arrows) in the ablated tumor region 4 days after ablation (A). By day 8 (B), new blood vessels (black arrow) are forming in the ablated region. Scale bars are 100 μm.