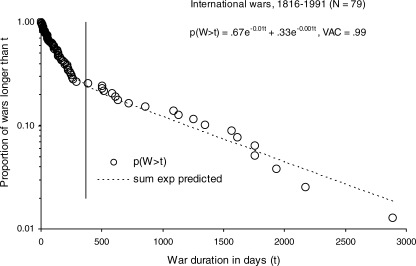
Fig 1.
Survivor plot of the durations of all international wars between 1816 and 1991, based on a data set provided by the Correlates of War project. The data are fitted by the sum of two exponential functions with the parameter values indicated; the y-axis is logarithmic. The vertical line marks one year from war onset.

