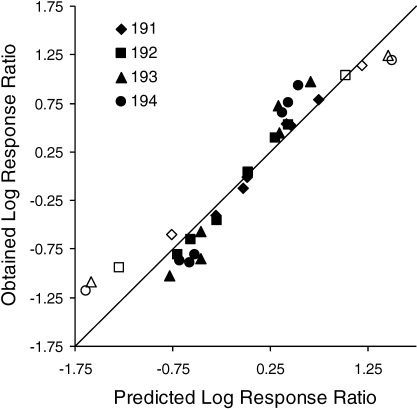
Fig 12.
Mean log response ratios for the second half of trails in the eight types of sessions from Experiment 2. Values predicted by the concatenated generalized matching law (Equation 4a) are plotted on the x axis and obtained values on the y axis. The unfilled data points represent dominated sessions, the filled tradeoff sessions.

