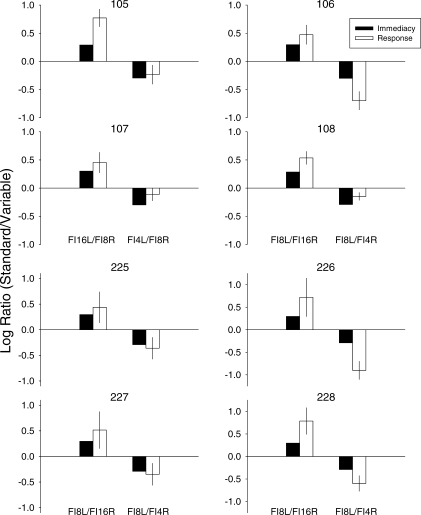
Fig 1.
Log obtained initial-link immediacy (filled bars) and response ratios (unfilled bars) in individual pigeons; the ratios shown are expressed as data for the option associated with the standard-delay (FI 8 s) to data for the option associated with the variable-delay (FI 4 s or FI 16 s). Values are means from all control sessions. For Pigeons 105 and 107, the standard-delay schedule (FI 8 s) occurred on the right key and the variable-delay schedule (FI 4 s or FI 16 s) occurred on the left key; for the remaining pigeons, this was reversed. Error bars show ±1 SD.

