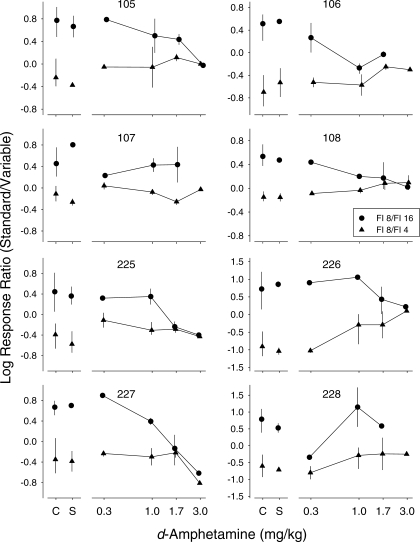
Fig 3.
Log initial-link response ratios (standard/variable) as a function of d-amphetamine dose for each pigeon, shown separately for sessions in which the variable terminal-link schedule was 16 s (circles) and 4 s (triangles). For Pigeons 105 and 107, the standard-delay schedule (FI 8 s) occurred on the right key and the variable-delay schedule (FI 4 s or FI 16 s) occurred on the left key; for the remaining pigeons, this was reversed. Points above C show data from control sessions and points above S show data from sessions preceded by saline administration. Data points show means and error bars show ranges. Note that the y-axis ranges for Pigeons 226 and 228 are greater than those for the other pigeons. The 3.0 mg/kg dose completely eliminated responding in Pigeons 106 and 228 when the terminal links were FI 8 s/FI 16 s. The 3.0 mg/kg dose inadvertently was not tested in Pigeon 107 under the FI 8 s/FI 16 s condition.

