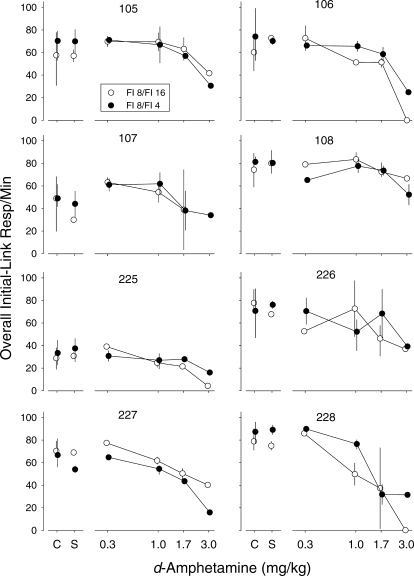
Fig 4.
Dose-effect functions for response rates during the initial links. Data were obtained by adding responses on the left and right keys and dividing by the time spent in the initial link. Open symbols show rates from sessions in which the terminal links were FI 8 s and FI 16 s and filled symbols show rates from sessions in which the terminal links were FI 8 s and FI 4 s. Other characteristics are as described in Figure 3.

