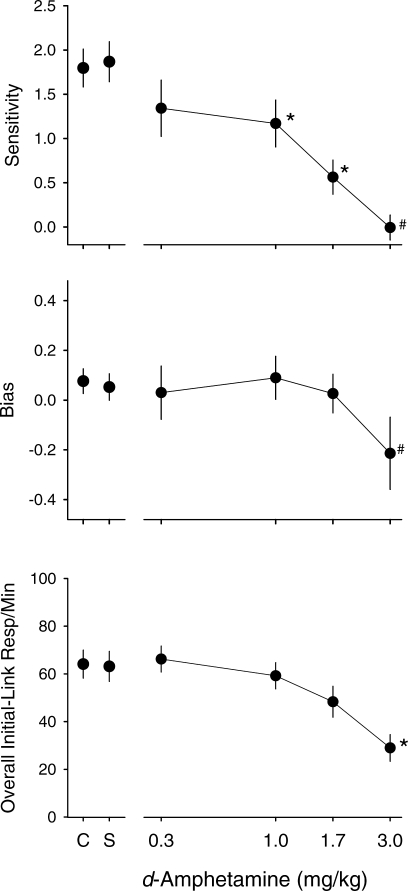
Fig 6.
Group dose-effect functions for sensitivity (upper panel), bias (middle panel), and overall initial-link response rates (lower panel). Data points are means from all pigeons (except at 3.0 mg/kg for sensitivity and bias, where the data points are means of 6 pigeons); error bars show SE. For each pigeon, overall initial-link response rate was obtained by averaging the rates across the different terminal-link pairs. Asterisks show values significantly different from those under saline; for sensitivity and bias, data for 3.0 mg/kg were not included in the statistical analysis (indicated by #).

