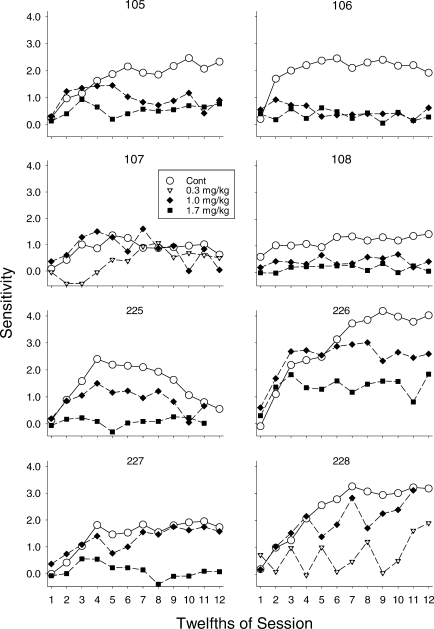
Fig 8.
Estimates of sensitivity across successive 12ths of the session for individual pigeons. The open circles show data from control sessions and the filled diamonds and squares show data from sessions preceded by 1.0 and 1.7 mg/kg d-amphetamine, respectively; for Pigeons 107 and 228, 1.7 mg/kg substantially decreased response rates, so for these pigeons effects of 0.3 mg/kg are shown by the inverted triangles with a white dot in the center.

