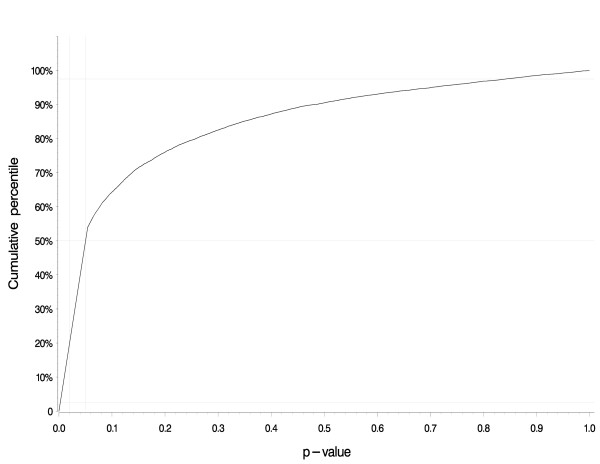
Figure 1.
Distribution of p-values yielded by 10,000 iterations of the bias analysis for alachlor. The cumulative distribution of p-values from the 10,000 tests of trend generated by the bias analysis. This result pertains to the trend associating lifetime alachlor exposure-days with the rate of all lymphohematopoietic cancers. The p-value for this trend equaled 0.02 in the original paper, but fewer than 20% of the bias analysis iterations yielded a p-value of 0.02 or lower. Approximately 50% of the iterations yielded a p-value below 0.05 and the remainder yielded p-values greater than 0.05.

