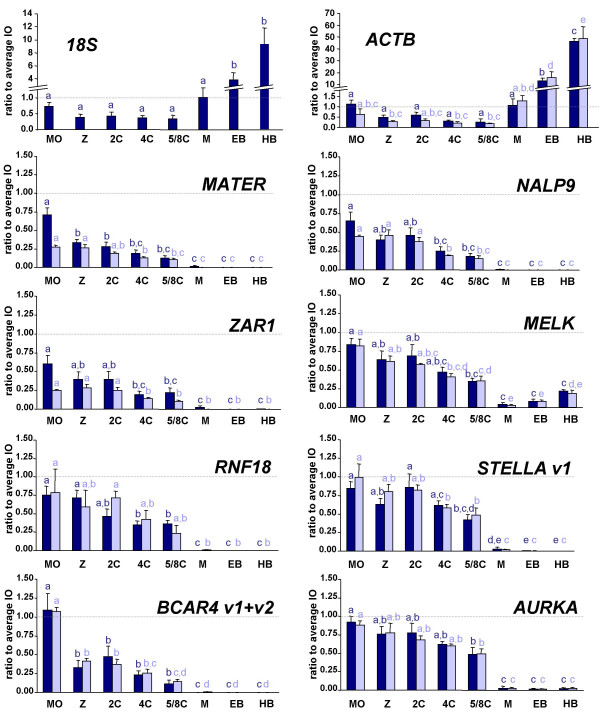
Figure 3.
Profile of transcripts throughout embryo development. Analysis of transcripts total forms (dark blue) and polyadenylated forms (light blue) during early embryo development: in vitro matured oocyte (MO), in vitro cultured zygote (Z), 2-, 4-, 5/8-cell embryos, morula (M), expanded blastocysts (EB) and hatched blastocysts (HB). The ratio to immature oocytes (set at 1, dotted line) is shown (mean ± SEM). Within the profiles of the total form or polyadenylated form, different superscripts indicate a significant difference (P < 0.05).

