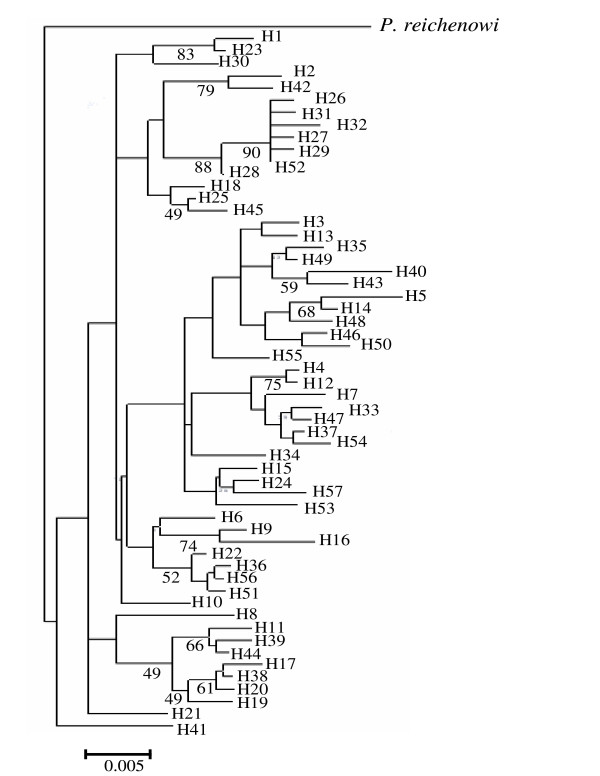
Figure 2.
A neighbor-joining (NJ) tree depicting the relationships between different AMA1 haplotypes observed among Indian P. falciparum populations. The distance matrix was prepared using Kimura 2-parameter evolutionary model. Alignment substitutions were considered for analysis while gaps were ignored. Numbers below the line indicate percentage bootstrap values for 1000 replications. The scale bar represents a genetic distance. The partial AMA1 sequence of P. reichenowi [AJ252087], the closet species to P. falciparum was taken as an out group [35].

