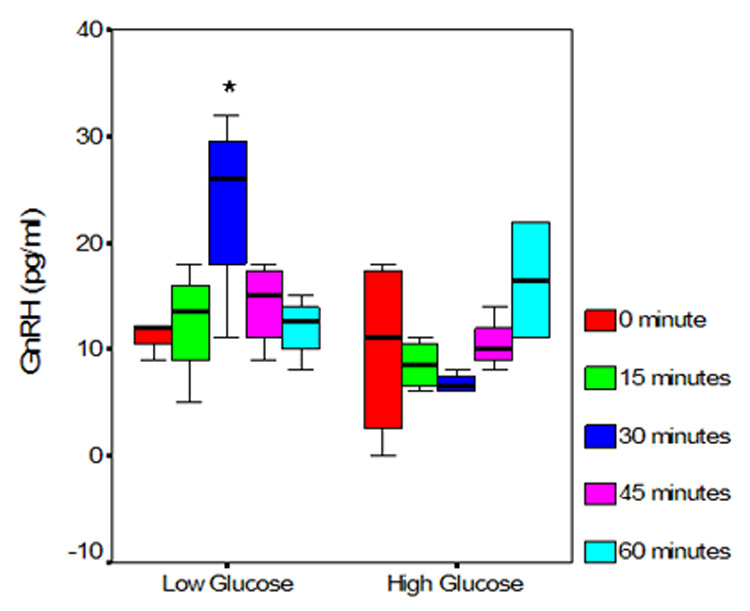
Figure 1. GT1 cells maintained in high glucose concentrations demonstrate lower amplitude of GnRH secretion during the initial 45 minutes of sampling.

Presented data represent a single experiment (six replicates per condition) following 72 hour exposure of cells to respective glucose concentrations GnRH secretion by cells maintained in high and low glucose media, presented as box-whiskers plots. The box represents the inter-quartile range, the horizontal line represents the median and whiskers the range. Note the higher amplitude of GnRH secretion at 0, 15, 30 and 45 minutes in cells maintained at low glucose concentrations. The differences are of statistical significance at 30 minute sampling interval (*).
