
Figure 3. Significantly higher prevalence of non-viable cells is noted in cultures maintained in high glucose concentrations.
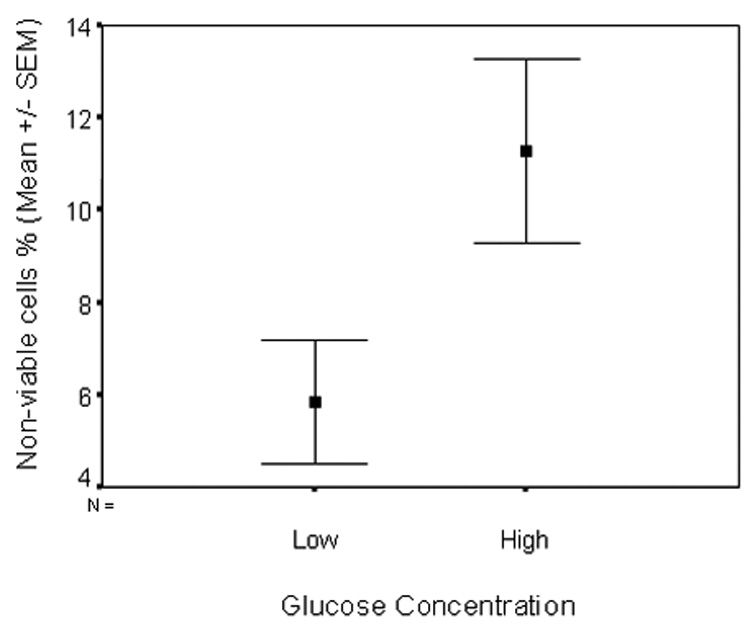
Cumulative data from 5 different experiments (three replicates per condition) following 43 (3 experiments) and 72 (2 experiments) hour exposure of cells to respective glucose concentrations. Data are presented as mean ± SEM.