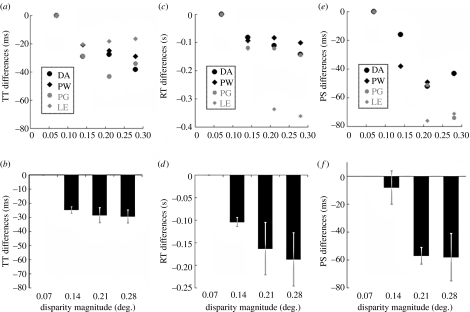
Figure 1.
Scatter plots (a,c,e) show data for four individual observers. Bar graphs (b,d,f) show data averaged across these observers. Error bars show ±1 s.e. (a) Scatter plot showing temporal detection threshold differences (TT differences), relative to temporal threshold estimates concerning disparity changes of 0.07°, as a function of disparity change magnitude. (b) Average TT differences. (c) Scatter plot showing RT differences, relative to RTs for disparity changes of 0.07°, as a function of disparity change magnitude. (d) Average RT differences. (e) Scatter plot showing perceived synchrony (PS) differences, relative to PS estimates concerning disparity changes of 0.07°, as a function of disparity change magnitude. (f) Average PS differences.

