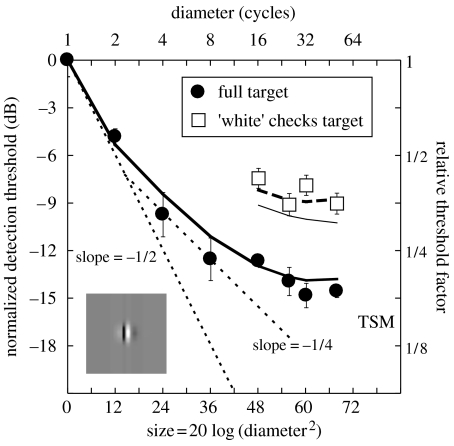
Figure 2.
Area summation results from experiment 1 and model predictions (thick curves). Error bars show ±1 s.e. The inset shows the weighting function of the filter used in the modelling. The abscissa refers to the area bounded by the outer edge of the stimulus plateau. The dotted lines are fiducial contours with slopes of −1/2 and −1/4. The thin curve beneath the open squares is described in the Discussion.

