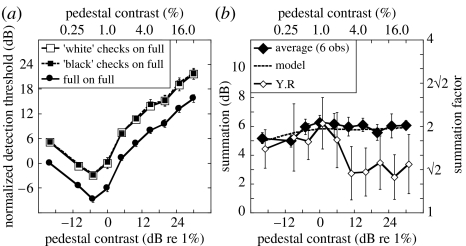
Figure 4.
Results from experiment 2 where the pedestal was always a full stimulus. Error bars show ±1 s.e. across observers, or for Y.R as appropriate. (a) Dipper functions averaged across six observers. (b) Sensitivity ratios for full target and average of ‘black’ and ‘white’ checks for the six observers in (a) (approx. 7200 trials per point) and a seventh observer Y.R. The function for Y.R is offset laterally by 1 dB for clarity. The model prediction (using equation (3.1)) is shown by the dashed curve.

