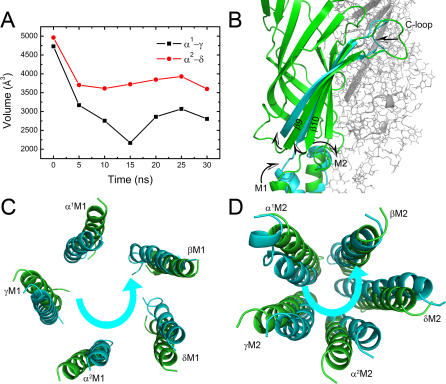
Figure 2. Collective Motions of the C-Loops, M1, and M2 Helices.
(A) The time-dependence of the volumes of ACh binding pockets. Black and red curves represent type-I (α1-γ) and type-II (α2-δ) pockets, respectively.
(B) The motion tendencies of C-loops, M1, and M2 reflected by the superposition of subunit α1 at the beginning (green) and after 30 ns simulation (cyan). The picture is displayed parallel to the pore axis.
(C–D) The anticlockwise motions of the M1 and M2 helices. The superpositions are based on the centers of mass of the five M1 and M2 helices, respectively, and the pictures are viewed from the synaptic cleft.

