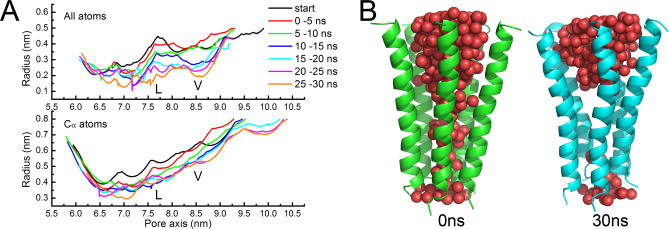
Figure 4. Changes of the Pore Channel.
(A) Pore radius profiles versus position along the pore axis. Curves represent the average radii changes over different time intervals for the all-atoms (top) and Cα atoms (bottom) of the five M2 helices.
(B) The volume change of the pore channel reflected by the water molecules embedded within the channel.

