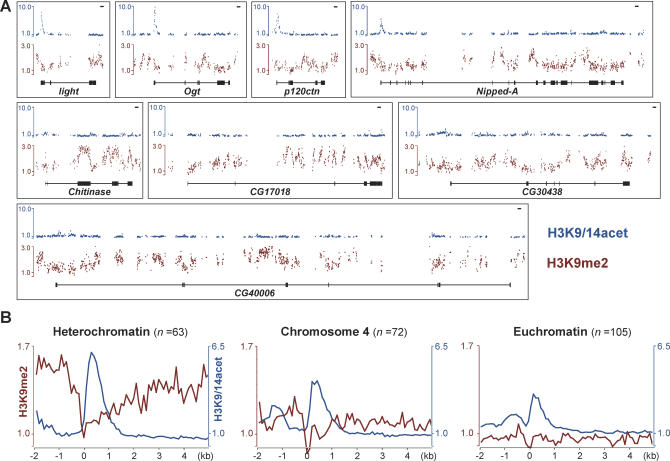
Figure 4. Modified-Histone Profiles of Heterochromatic Genes as Revealed by ChIP-chip Assays.
(A) Each panel shows a single gene with profiles of H3K9/14acet-enrichment (top, blue), H3K9me2-enrichment (middle, brown), and gene structure depicted in 5′ → 3′ orientation (bottom, black). Scale bar (line in upper right) is 1 kb.
(B) Each graph shows the average H3K9/14acet (blue, right y-axis) and H3K9me2 (brown, left y-axis) profiles of genes located in either in heterochromatin, Chromosome 4, or euchromatin of 3R, with n indicating number of genes in each class. To facilitate the analysis of euchromatic genes, only genes on the plus strand in a 3 Mb region of Chromosome 3R (coordinate 22.5–25.5Mb) were included. Gene sequences were aligned at the annotated 5′-ends (0 on the x-axis), broken into 100 bp windows, and the enrichment factors for all probes included in each window were averaged and plotted.

