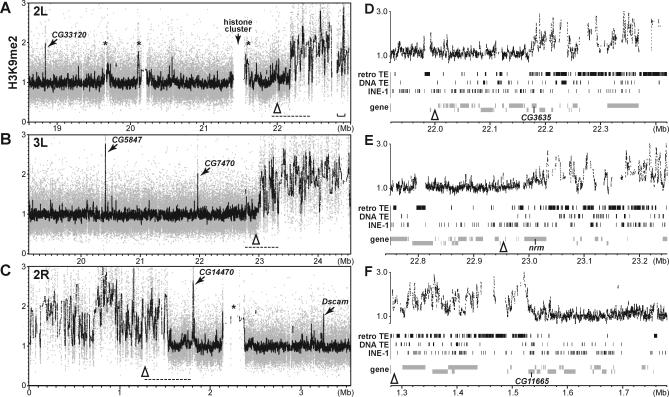
Figure 6. H3K9me2 Landscapes in the Euchromatin-Heterochromatin Transition Zones.
(A–C) H3K9me2-enrichment relative to the genomic DNA reference control in the chromosome arms 2L (A), 3L (B), and 2R (C). Each panel corresponds to approximately one-sixth of the assembled genome sequence located at the proximal base of the chromosome arm (Figure 2A). Raw data are shown in gray and moving average values of 50 adjacent probes are shown in black. The R5.1 genomic coordinates are shown on the x-axes. Open triangles note locations of the R5.1 heterochromatin sequence reference points which are reported in FlyBase and were designated as heterochromatic by Smith et al. [39] based on chromosomal fluorescent in situ hybridization localizations. The asterisks indicate euchromatic regions with high TE-density. The bracket in (A) marks the interval containing lt, cta, and Chitinase genes.
(D–F) Expanded views of the transition zones whose locations are marked by the dashed lines in (A–C). In each panel, the H3K9me2-enrichment values (moving average of ten adjacent probes) are shown in upper diagram and distributions of TEs, and genes are shown below. Genes are depicted in two tiers to distinguish 5′ to 3′ orientations. Apparent overlap among TEs and between TEs and genes are due to nesting events. Locations of the CG3635, nrm, and CG11665 genes, which are located at the abrupt transitions to the enriched H3K9me2 domains at the base of 2L, 3L, or 2R respectively, are noted.

