
Fig. 4.
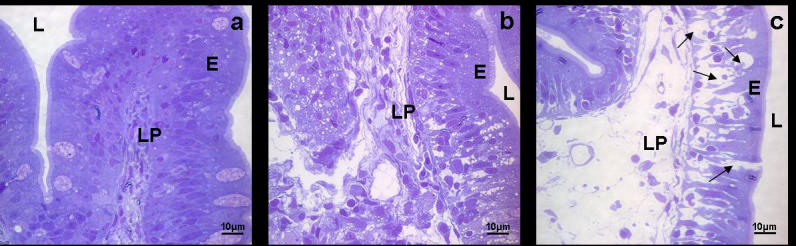
Light micrographs of semithin sections of seabream intestine at different stages of cell extraction. L (lumen), E (enterocytes), LP (lamina propria). (a) Gut semithin section at the beginning of the isolation procedure (control sample, time 0). Bar: 10 μm. (b) Gut semithin section after 10min in DTT. Bar: 10 μm (c) Gut semithin section after 10 min in DTT and 60 min in collagenase (0.15 mg/ml). Note the open interepithelial spaces (arrows) that allow leucocytes to be freed into the media. Bar: 10 μm.