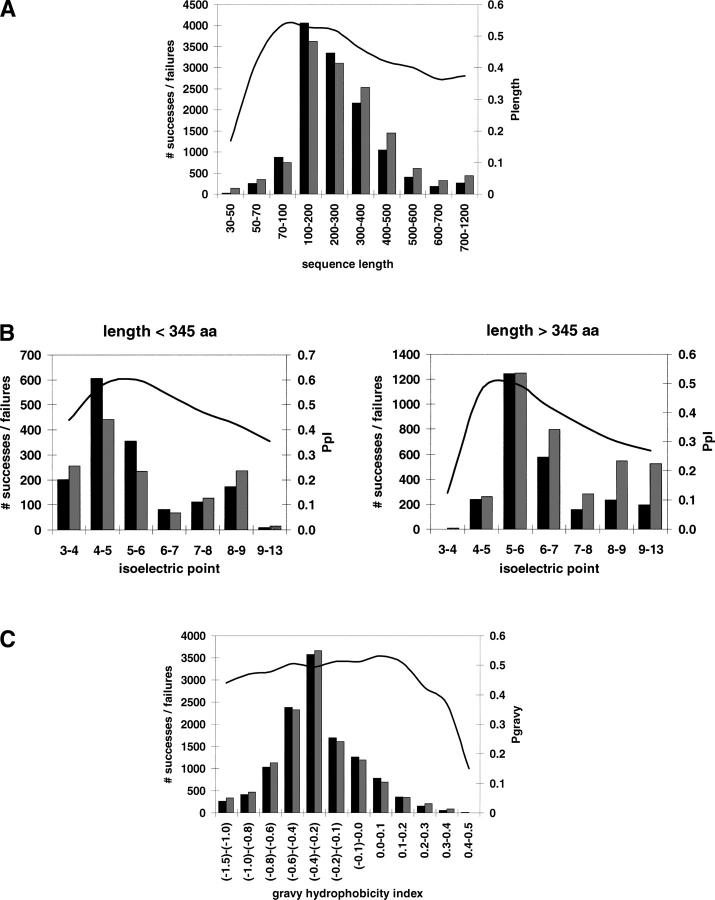
Figure 1.
Observed distributions of successes and failures and calculated probabilities of successful protein production for (A) sequence length, (B) isoelectric point for short and long proteins, and (C) gravy hydrophobicity index. The number of successfully produced proteins in each bin are shown as black bars, and the number of proteins that failed in the production process are shown as gray bars (i.e., they are associated with the left vertical axis). The probability of protein production calculated as the fraction of successfully produced proteins for all proteins from the same bin is shown as a continuous line (i.e., it is associated with the right vertical axis).

