Figure 2.
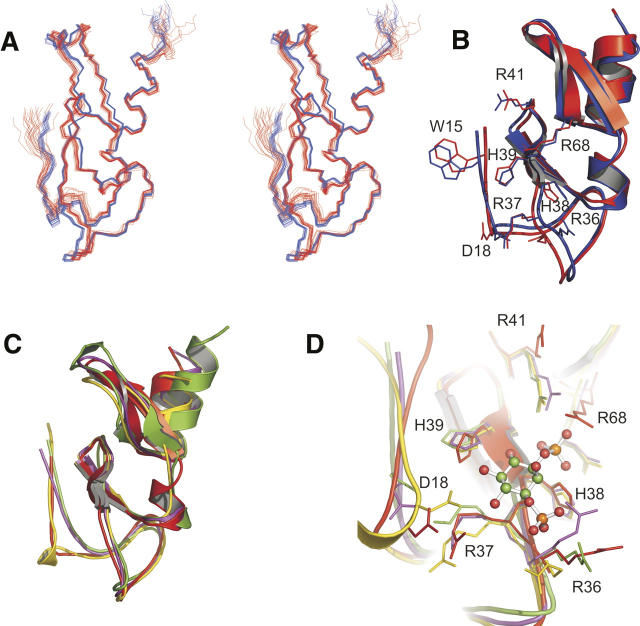
FYVE domain of LmFYVE-1(1–79). (A) Stereoview of LmFYVE-1(1–79). (Blue) Structure refined against RDCs, (red) unrefined structure. (B) Cartoon representation of LmFYVE-1(1–79) showing selected side chains. (C) Overlay of FYVE domain structures. (Red) LmFYVE-1(1–79), (yellow) EEA1(1347–1410), (purple) HRS(156–218), (green) Vps27 (168–230). (D) Overlay of FYVE domain active site showing positioning of functional residues. The EEA1-bound ITP ligand as observed in the EEA1 crystal structure is shown as a ball and stick model.

