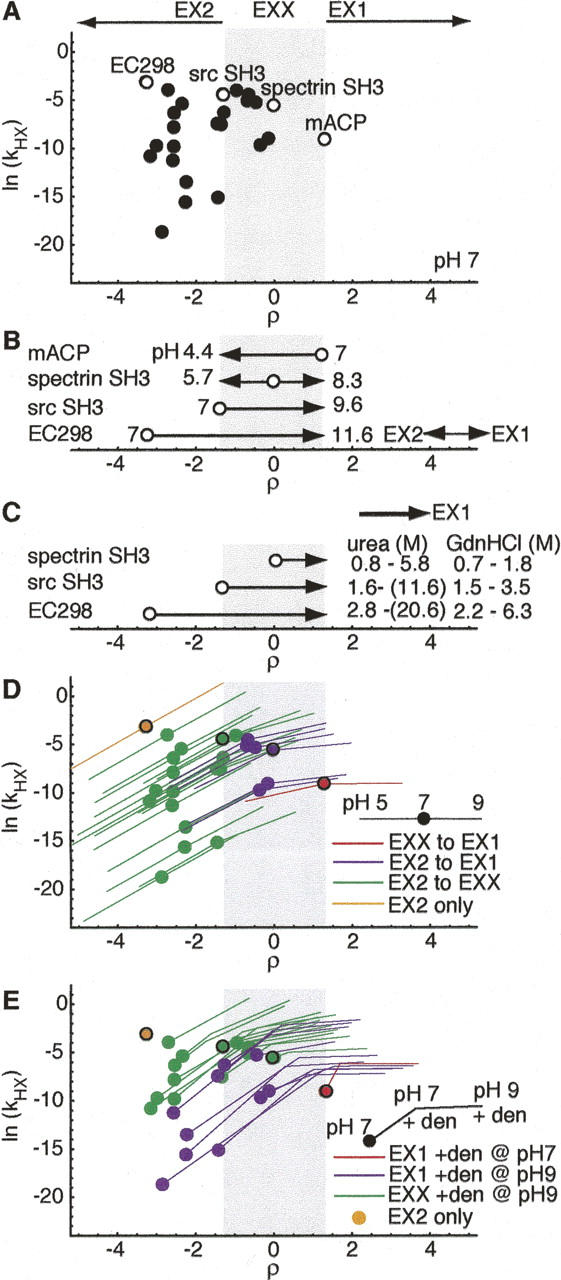
Figure 3.

Global HX behavior for two-state proteins. (A) Distribution of HX behavior expected for stable two-state proteins with ku and kf characterized under standard conditions of 50 mM ionic strength, pH 7, 25°C (Maxwell et al. 2005). Circles denote global exchange of proteins from analysis set. Open circles indicate representative proteins spanning the range of observed HX behavior (ρ = −3.3, Eco298; ρ = 1.3, srcSH3; ρ = 0, specSH3; ρ = 1.3, mACP). (B) Calculated change in pH required to reach limiting regimes, relative to ρ positions at pH 7 (open circles) of representative proteins. (C) Calculated denaturant concentration required to shift HX from physiological ρ value to EX1. Concentration ranges calculated using maximum and minimum urea and GdnHCl m‡ f values reported for proteins in analysis set. (D) HX behavior accessible between pH 5 and pH 9. Circles indicate HX sampled at pH 7. Red indicates mACP, which samples only EX1, purple indicates proteins, which sample both EX2 and EX1, green indicates proteins, which sample EX2 and EXX, and orange indicates EC298, which samples only EX2 between pH 5 and pH 9. (E) HX behavior accessible upon addition of denaturant at modest levels (maintaining ku/kf = 0.01: ΔGU = 11.4 kJ/mol), at pH 7 and pH 9. Red indicates proteins that sample HX far enough into EX1 with denaturant addition at pH 7 to allow ku extrapolation, purple indicates proteins that sample HX far enough into EX1 with denaturant added at pH 9 to allow ku extrapolation, green indicates those that shift only to EXX with denaturant addition at pH 9, and orange indicates EC298, which is only 11.4 kJ/mol stable without denaturant.
