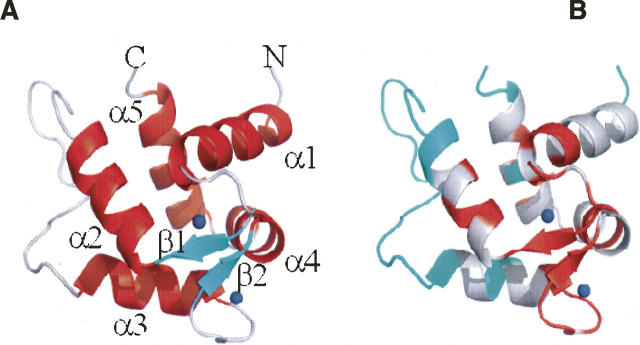
Figure 5.
Ribbon plot (The PyMOL Molecular Graphics System, DeLano Scientific) depicting the averaged minimized NMR structure of calsenilin EF3–4 (residues 161–256). (Blue dots) Ca+2 ions present in the structure. (A) (Red) α-helices, (green) β-strands, and (gray) loops. (B) The ribbons are colored red for those residues whose backbone amides are observed after 30 min in D2O. The ribbon corresponding to residues with unassigned amides are colored blue.

