
Figure 3.
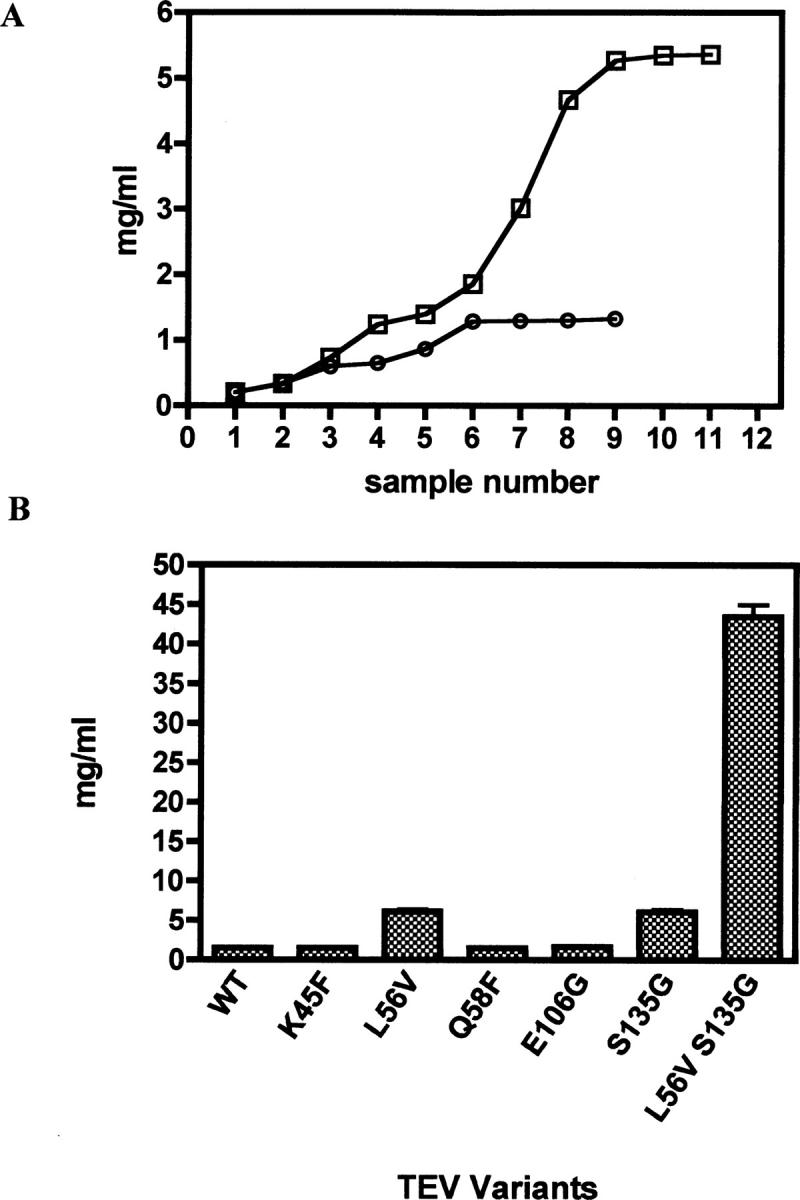
Solubility of the TEV variants. (A) Solubility curve for (○) WT and (□) L56V. The “maximum” concentration is obtained from the plateau observed in concentration. (B) Comparison of maximum concentrations obtained for each of the variants relative to WT TEV; the data shown represent the average of five separate experiments.