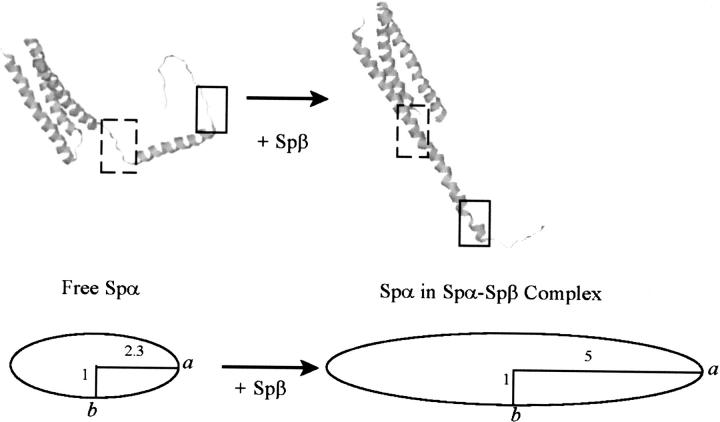
Figure 10.
NMR structure of Spα (Protein Data Bank: 1OWA) (left), showing the regions prior to (dashed-line square) and following (solid-line square) Helix C′ in an unstructured conformation, and a model structure of Spα in Spα–Spβ complex (right), showing the regions prior to (dashed-line square) and following (solid-line square) Helix C′ in a helical conformation. A prolate ellipsoid model, with a major (long) axis of ∼5 and a minor (short) axis of 1, was used to represent a rigid and asymmetric shape of the complex.

