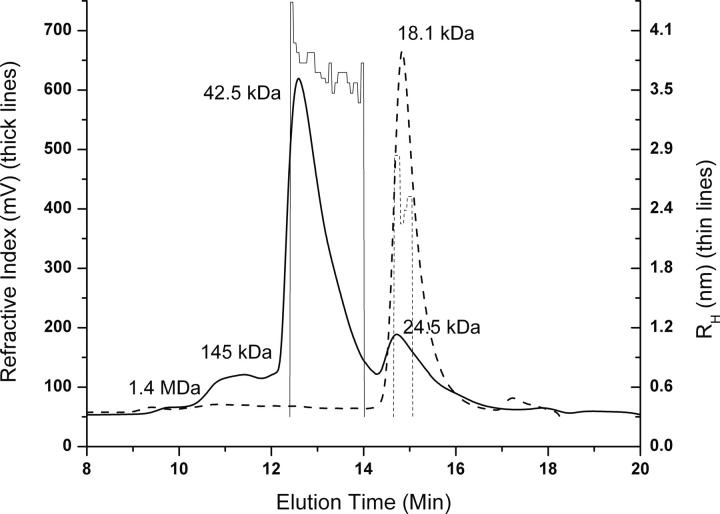
Figure 3.
Chromatograms of Spα alone (thick dotted line) and of the Spα–Spβ complex (thick solid line). In both samples, the concentration for Spα was 0.3 mM. In the complex, the concentration for Spβ was 0.39 mM. A sample (100 μL) was injected onto a YMC Diol-200 (8.0 × 300 mm) column and eluted with PBS, pH 6.5, at a rate of 0.7 mL/min. Mass values from amino acid sequences are 18.6 kDa for Spα, 22.1 kDa for Spβ, and 40.7 kDa for the complex. Measured M w values are 18.1 kDa for Spα alone and 42.5 kDa for the complex. The value for residual Spβ is 24.5 kDa. The two peaks with M w of ∼1.4 mDa and 145 kDa are likely to be oligomers of the complex. R H tracings of Spα alone (thin dotted line) and of the complex (thin solid line) are also shown.

