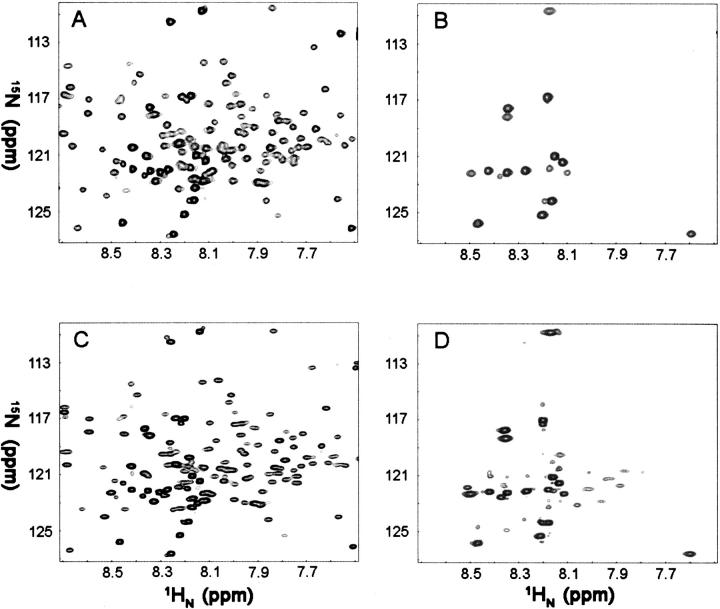
Figure 5.
HSQC spectra of 15N-labeled Spα alone (0.30 mM, 8 scans) (A) and in the presence of molar excess, unlabeled Spβ (160 scans) (B). TROSY-HSQC of 15N,2H-labeled Spα alone (0.30 mM, 16 scans) (C), and Spα (0.30 mM) in the presence of molar excess unlabeled Spβ (64 scans) (D). All samples were in PBS, pH 6.5. NMR spectra were taken at 20°C on a Bruker 900-MHz spectrometer. A total of 1536 × 256 complex points were acquired with sweep widths of 12,626 × 3283 Hz in the direct and indirect dimensions, respectively.

