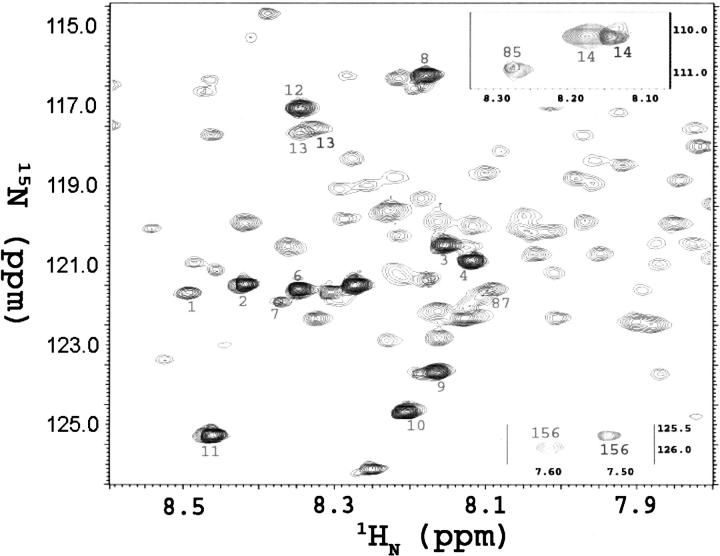
Figure 8.
Overlapping HSQC spectra for Spα (light) and Spα–Spβ complex (dark, with peaks numbered 1–4, 6–14, 83, 85, 87, and 156) at 900 MHz. The spectra of 15N-Spα (0.40 mM) in PBS at pH 6.5, with 95% H2O and 5% 2H2O, were accumulated for eight scans (20 min). Spectra of 15N-Spα, or SpαII, with excess unlabeled Spβ (0.56 mM to give Spβ/Spα molar ratios of 1.4) were accumulated for 160 scans (6.7 h). Peaks 13, 14, and 156 in complex were shifted slightly. Most of the signals observed in samples of Spα alone were not detected in samples of the Spα–Spβ complex.

