
Figure 5.
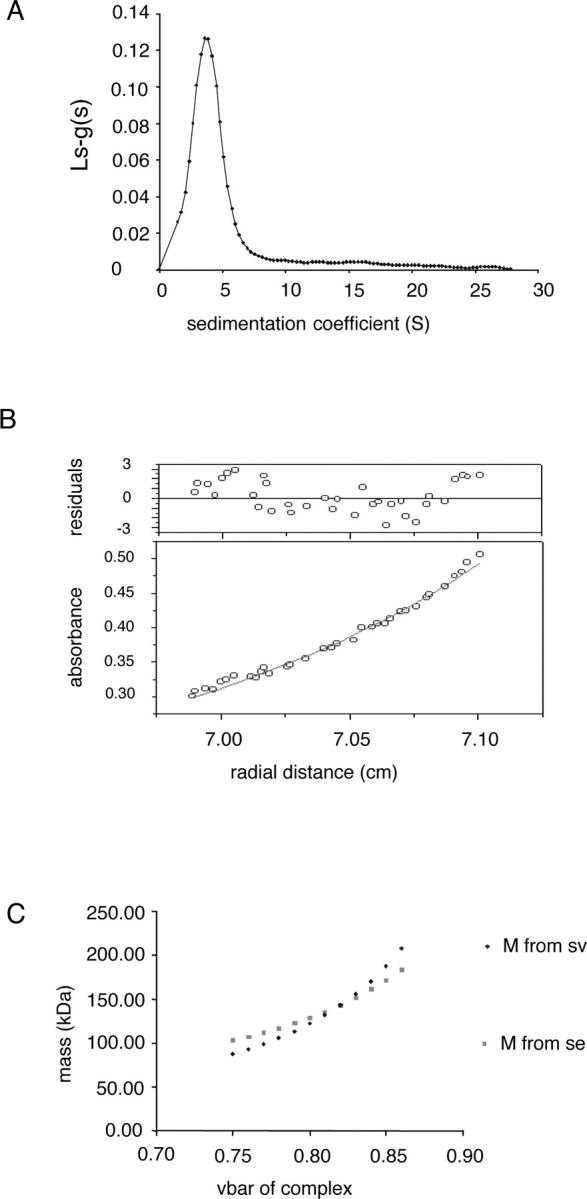
Analysis of the oligomeric state of Cd36 in OG micelles by analytical ultracentrifugation. (A) Sedimentation velocity analysis conducted with a single concentration of Cd36 (0.5 mg/mL). Data are plotted showing the apparent sedimentation coefficient distribution obtained from the ls-g*(s) model of SEDFIT, as described in Materials and Methods. (B) Equilibrium distribution for protein–detergent molecular mass obtained from sedimentation equilibrium analysis of Cd36 in OG, with the residuals shown in the upper panel. (C) Molecular weights for Cd36 protein–detergent complex derived from sedimentation velocity and equilibrium data, at different partial specific volumes, are plotted.