
Figure 5.
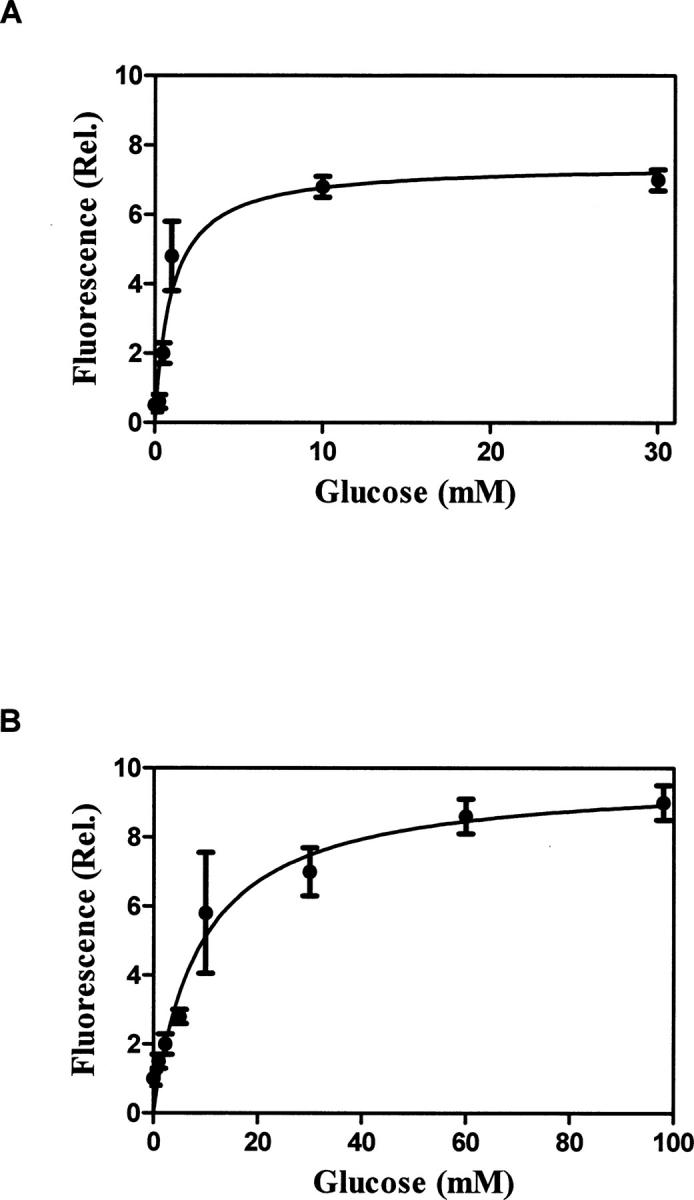
Determination of glucose affinity for the selected mutant. (A) Purified and IANBD-labeled E149C/A213R was challenged with increasing concentrations of glucose, and the fluorescence response was graphed. This demonstrated a Kd equal to 1 mM and a sevenfold fluorescent response. (B) The glucose affinity of the E149C/A213R/L238S mutant was determined in the same manner and demonstrated an eightfold increase in fluorescence and Kd equal to 10 mM.