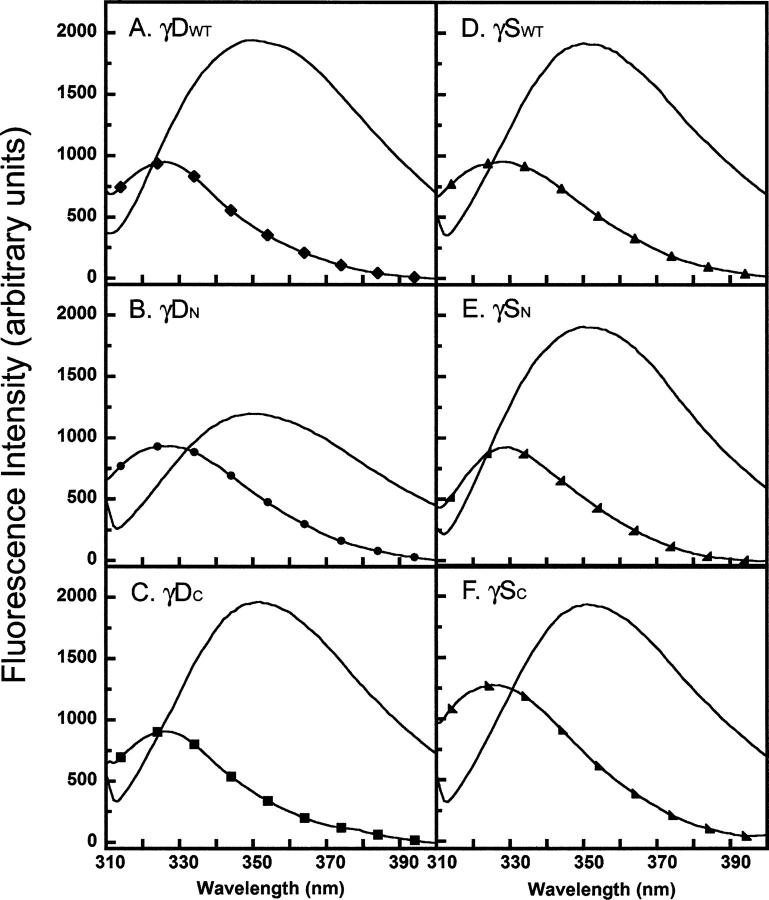
Figure 5.
Fluorescence emission spectra of native and unfolded isolated domains and full-length γDWT and γSWT. All proteins were excited at 295 nm and emissions were recorded from 310 to 400 nm. Samples consisted of 10 μg/mL protein in 100 mM sodium phosphate, 1 mM EDTA, 5 mM DTT, pH 7.0, and 5.5 M GuHCl for unfolded samples equilibrated at 37°C. (A) Native spectra for γDWT (♦) and unfolded spectra for γDWT (line). (B) γDN native (•) and γDN unfolded (line). (C) γDC native (▪) and γDC unfolded (line). (D) γSWT native (▴) and γSWT unfolded (line). (E) γSN native (◢) and γSN unfolded (line). (F) γSC native (◣) and γSC unfolded (line).

