
Figure 8.
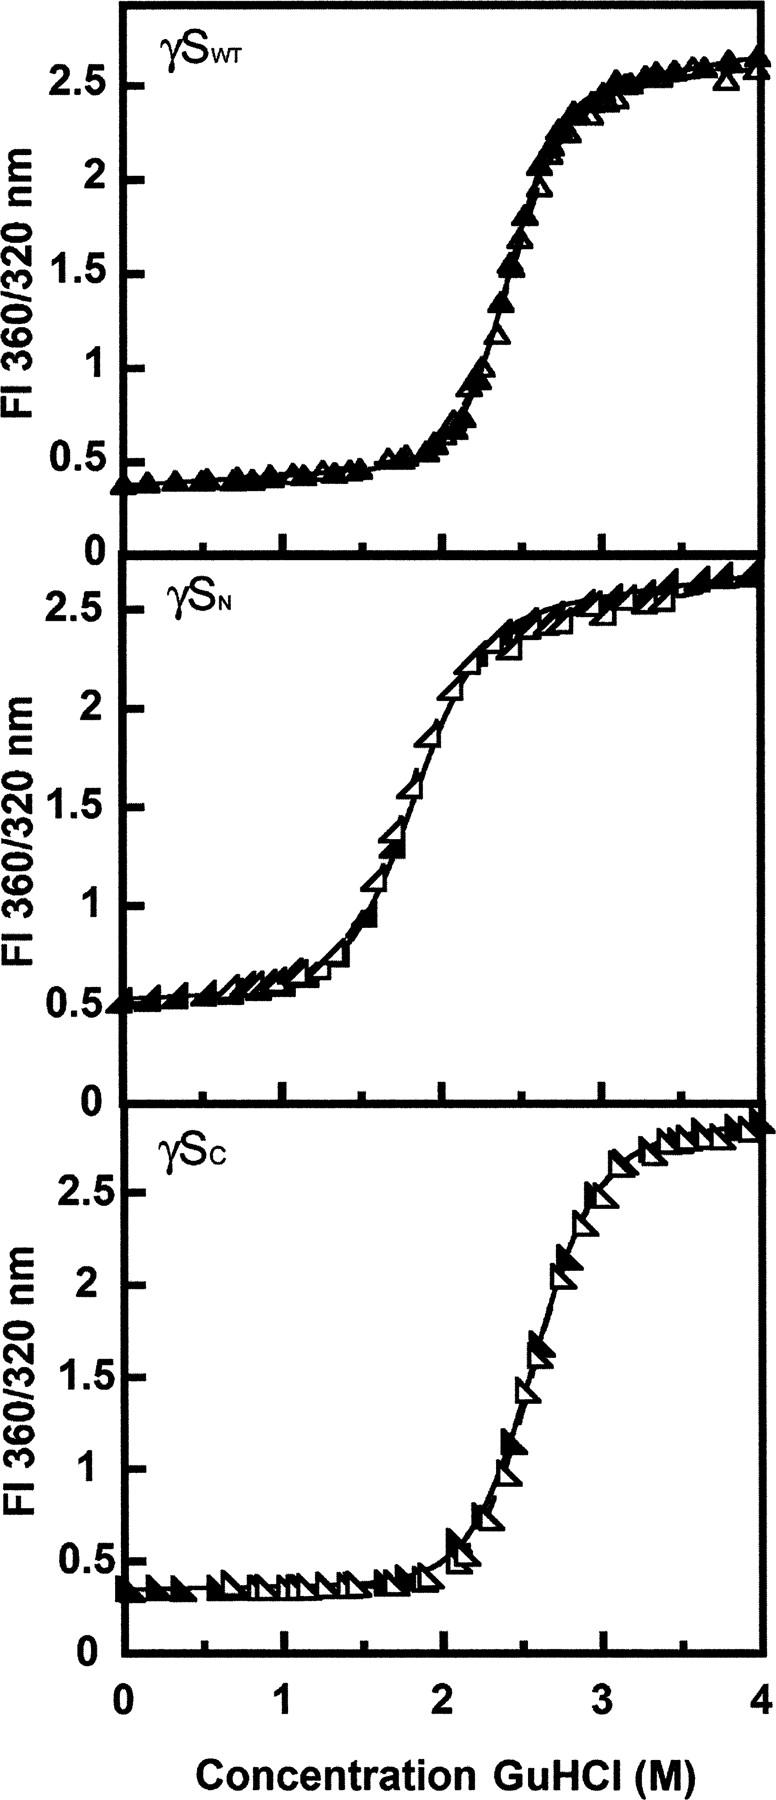
Equilibrium unfolding (closed symbols) and refolding (open symbols) transitions for (▴) γSWT, (◢) γSN, and (◣) γSC. Samples contained 10 μg/mL protein, 100 mM sodium phosphate, 1 mM EDTA, 5 mM DTT (pH 7.0), and various concentrations of GuHCl at 37°C. The ratios of fluorescence emission at 360 nm and 320 nm were calculated and plotted versus the concentration of GuHCl. Two-state fits of the equilibrium data are indicated by solid black lines.