Figure 1.
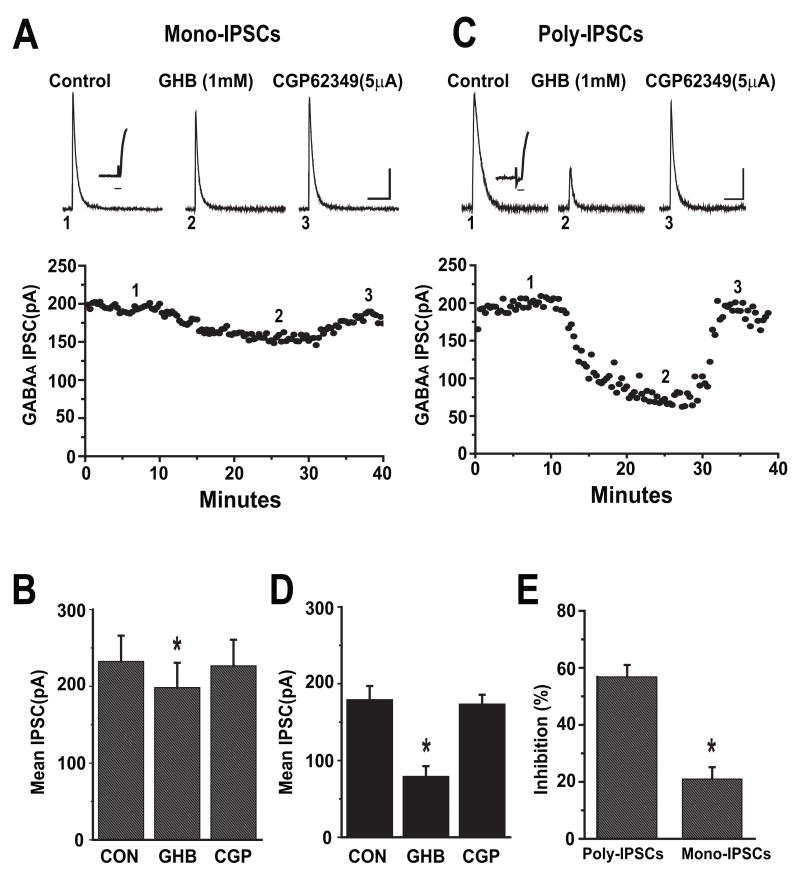
GHB has more potent inhibitory effects on evoked polysynaptic IPSCs than monosynaptic IPSCs in cortical pyramidal cells. (A). Upper panel, average traces of mono-synaptic IPSCs isolated pharmacologically from a prefrontal cortical pyramidal cell held at 0mV are shown. 1 mM GHB reduced the peaks of IPSCs and was reversed by bath application of 5 μM CGP 62349. Number placements correspond to the traces evoked at the time shown in the time course of the responses in the lower panel. Scale bar: 100 ms/50 pA. Inset trace illustrating the latency from stimulation artifact to the onset of the evoked IPSCs. Time scale: 6ms. Lower panel: Time course of GHB induced inhibition of IPSCs recorded from the same cell.
(B) Bar graph shows the effects of GHB on mean amplitude of monosynaptic IPSCs (n= 9). * denotes p<0.05.
(C) Upper panel, average traces (5–7) of polysynaptic IPSCs isolated from a cortical pyramidal cell held at 0mV are shown. 1 mM GHB reduced the peaks of IPSCs and was reversed by bath application of 5 μM CGP 62349. Number placements correspond to the traces evoked at the time shown in the time course of the responses in the lower panel. Scale bar: 100 ms/50 pA. Inset trace illustrating the latency from stimulation artifact to the onset of the evoked IPSCs. Time scale: 6ms. Lower panel: Time course of GHB induced inhibition of IPSCs recorded from the same cell.
(D) Bar graph showing the effects of GHB on mean amplitude of polysynaptic IPSCs (n=7). * denotes p <0.05.
(E) Bar graph showing the average percent inhibition of GHB on the mean amplitude of polysynaptic IPSCs and monosynaptic IPSCs. GHB had more potent inhibitory effects on polysynaptic IPSCs than monosynaptic IPSCs (unpaired t-test, p<0.001). * denotes p <0.001.

