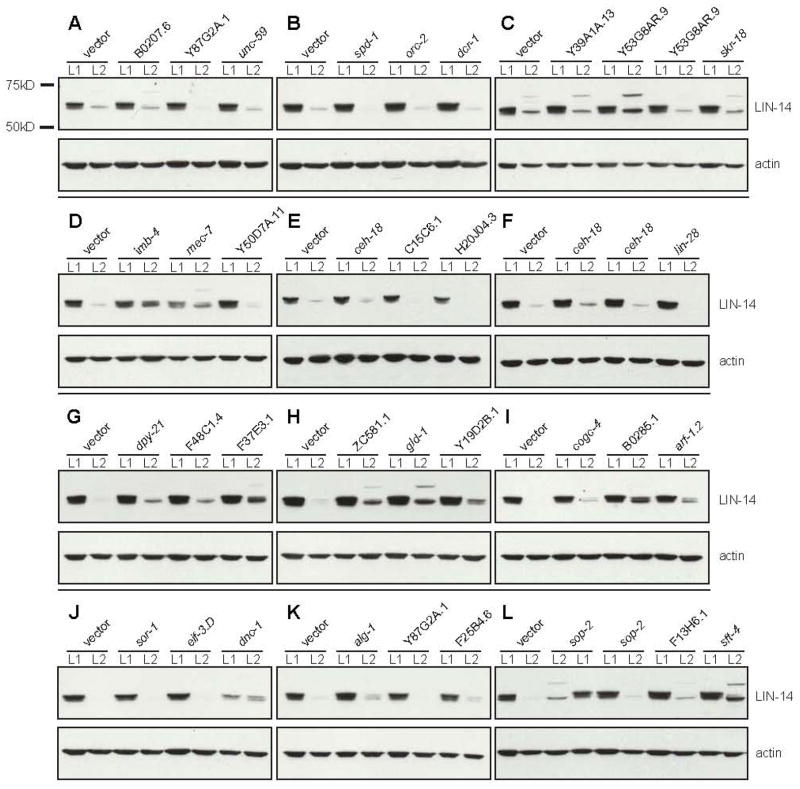
Figure 3. LIN-14 Western blots.
Protein samples from synchronized L1 and L2 (24 hours at 20 °C) worms are shown for each RNAi treatment. LIN-14 levels drop dramatically from L1 to L2 when fed empty vector control. Due to variations in LIN-14 intensity between blots all comparisons were made to the empty vector control lanes for each blot to determine if LIN-14 down-regulation was affected.

