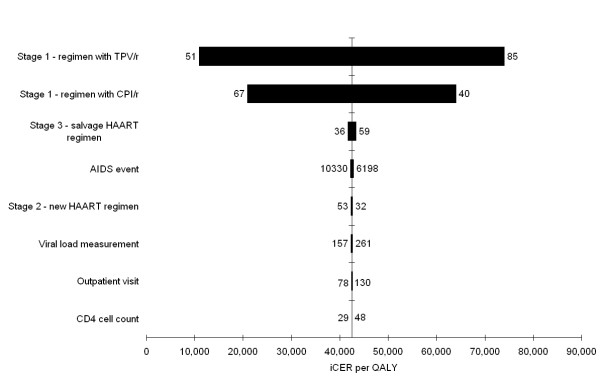
Figure 2.
Tornado diagram of the sensitivity analysis. Tornado diagram of the univariate sensitivity analysis showing the impact of individual cost parameters on the iCER per QALY. Parameter values of 75% and 125% of the base-case value were evaluated and these values are shown on both sides of the bars. All parameters refer to costs and are expressed in Euro price level 2006. TPV/r tipranavir with ritonavir. CPI/r comparator protease inhibitor with ritonavir. HAART highly active antiretroviral therapy. iCER incremental cost effectiveness ratio. QALY quality adjusted life year.

