
Figure 3.
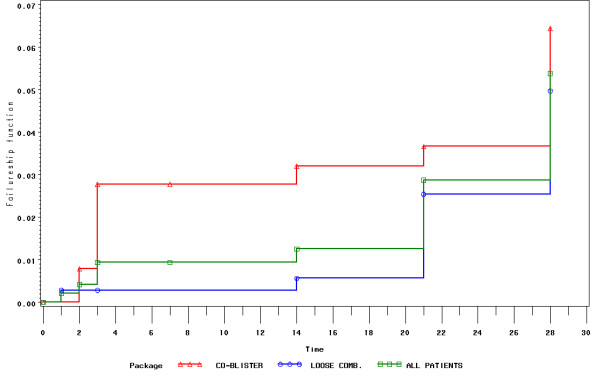
Kaplan-Meier of one minus survival curves to show cumulative parasitological failure rates overall (2000–05) and by year of treatment (all ages combined).
Official websites use .gov
A
.gov website belongs to an official
government organization in the United States.
Secure .gov websites use HTTPS
A lock (
) or https:// means you've safely
connected to the .gov website. Share sensitive
information only on official, secure websites.
Kaplan-Meier of one minus survival curves to show cumulative parasitological failure rates overall (2000–05) and by year of treatment (all ages combined).