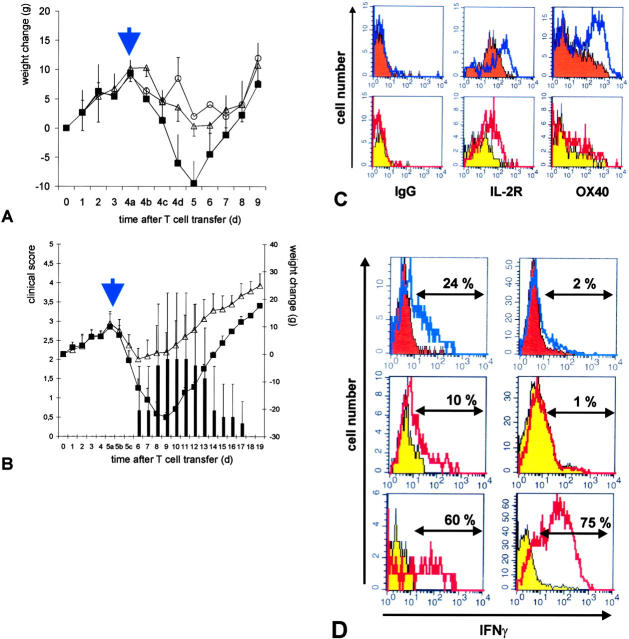
Figure 6.
Intrathecal injection of antigen activates weakly pathogenic TGFP cells and aggravates clinical disease. Intrathecal injection of 20 μg of specific antigen (A, S100β; B, MOG, closed squares and black bars) or 20 μg of control antigen (OVA, open triangles) was performed at day 4 (A, S100β-EAE) or day 5 (B, LE-MOG-EAE) after T cell transfer. Control animals, which did not receive intrathecal injection, are shown (black circles). Weight loss was monitored daily, at day 4 (A) or 5 (B) in closer time intervals (4/5a: 1 h before; 4/5b: 4 h after; and 4/5c: 8 h after intrathecal S100β/MOG injection). Animals that had received 20 μg of specific antigen intrathecally showed enhanced weight loss starting 8 h after antigen injection. Animals of TLE-MOG-GFP cell–induced EAE developed clinical symptoms reaching maximal scores of three (B, black bars). Mean value and standard deviation of five independent experiments (S100β) and three independent experiments (MOG) are shown, including eight animals/treatment group. (C) TS100β-GFP (orange histograms) or TLE-MOG-GFP cells (yellow histograms) were isolated from spinal cords of control antigen (shaded histograms, 20 μg OVA) or specific antigen (overlay histograms, 20 μg S100β or MOG, respectively)–treated animals 4 h after intrathecal injection, and were analyzed cytofluorometrically for the expression of IL-2R and OX-40 antigen (OX-40). TGFP cells from specific antigen-treated but not OVA-treated animals up-regulated OX-40 antigen and IL-2R. (D) Intracellular IFNγ staining of TS100β-GFP (orange histograms) or TLE-MOG-GFP cells (yellow histograms) after intrathecal treatment with control antigen (shaded histograms, 20 μg OVA) or specific antigen (overlay histograms, 20 μg S100β or MOG, respectively). 4 h after intrathecal antigen injection TGFP cells in the CNS (top left histogram, TS100β-GFP cells, 24% of cells were IFNγ+; middle left histogram, TLE-MOG-GFP cells, 10% of cells were IFNγ+) but not in the spleen (top right histogram, TS100β-GFP cells, 2% of cells were IFNγ+; middle right histogram, TLE-MOG-GFP cells, 1% of cells were IFNγ+) up-regulated IFNγ production. Upon stimulation with PMA/ionomycin (unshaded overlay histograms), a high percentage of TLE-MOG-GFP cells isolated from CNS (bottom left histogram), and spleen (bottom right histogram) produced IFNγ. Representative results of two independent sets of experiments/antigen are shown.

