
Figure 7.
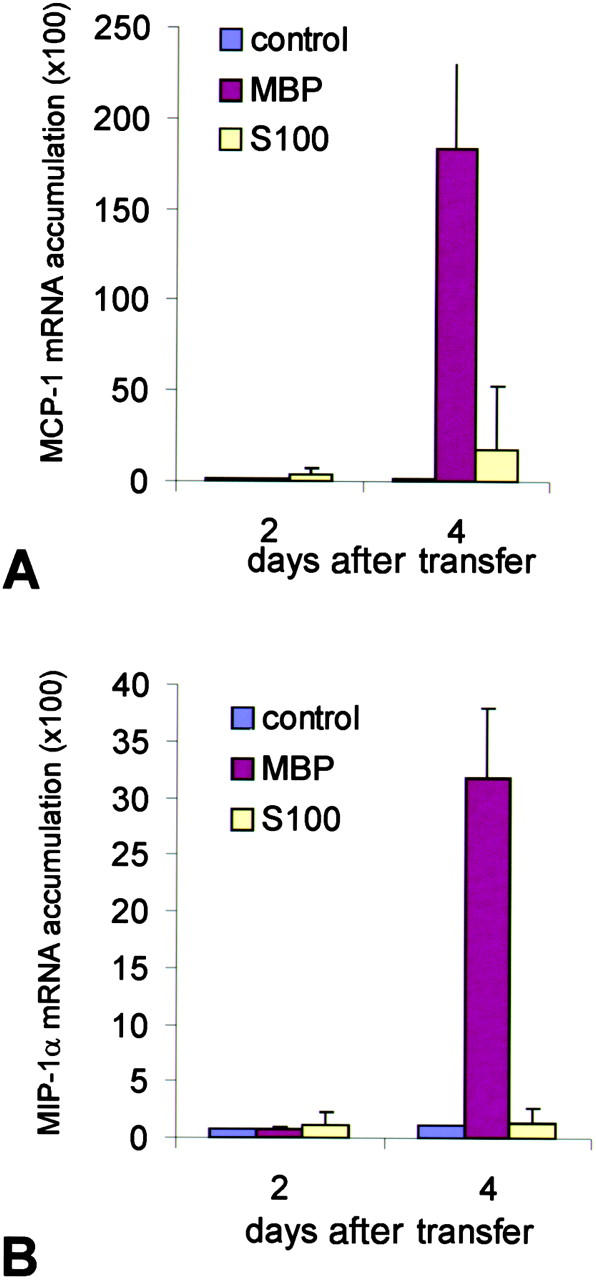
Quantitative chemokine mRNA expression in the CNS. The relative amount of mRNA transcripts for (A) MCP-1 and (B) MIP-1α was analyzed from spinal cord tissue of MBP-EAE (MBP), S100β-EAE (S100), and control animals (control) by dot blot hybridization at days 2 and 4 after transfer. Note the massive up-regulation of MCP-1 and MIP-1α mRNA in the CNS of TMBP cell–treated, but not in the TS100β cell–treated, animals. Amplification of β-tubulin and analysis on ethidium bromide–stained agarose gels demonstrated intact RNA in all samples (not depicted). The data were confirmed in a second set of independently prepared samples.